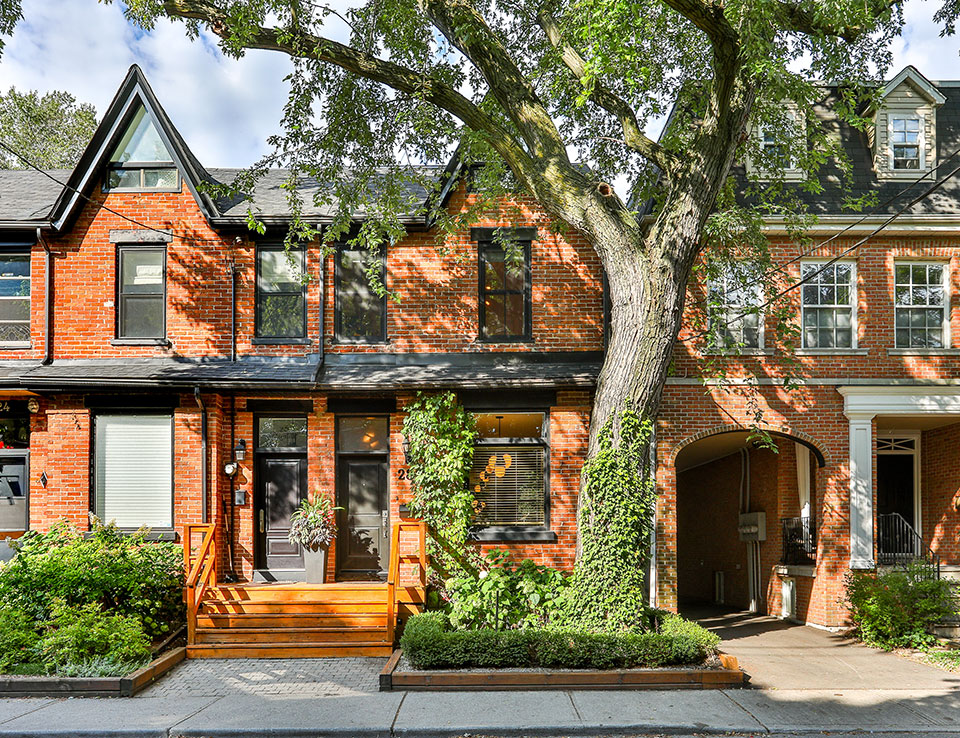
Reading the Signals: What Toronto’s July 2026 Market Data Really Tells Us About the Fall
If anyone tried to get a clear understanding of Toronto’s real estate market this summer, it would be no surprise to find themselves confused. The reports went from predicting disaster to talking of a recovery from week to week; the World Cup took over people’s attention; trade negotiations were the main topic in the news; and the normal summer slowdown only made the figures more unclear. The end result is a market which is truly difficult to interpret, a huge mess, as we said on this month’s podcast.
Alright, let’s get to the point. The July 2026 figures obtained from the Toronto Regional Real Estate Board, concentrating on the 416 area where we work, are presented here, with some anecdotes from our firsthand experience included. The main questions that both buyers and sellers are asking are whether the market has reached a bottom and what action they should take as they approach autumn. In short, the leading indicators are gradually becoming positive, even though prices have still been moving up and down.
Watch the Full Episode
If you’d rather watch than read, in this episode Ralph Fox and Kori Marin look at the subject and provide some practical insights which they have gained from assisting hundreds of buyers and sellers in Toronto.
The Headline: A Mixed Bag That Leans Positive
Looking at sales, the number of transactions in the 416 area rose by 1.7 per cent compared with the same month last year, whereas the entire GTA saw a decrease of 0.9 per cent. Although neither figure is significant, the difference is important since it shows a slight increase in activity in the central area and a slight decrease in the wider region.
Actually, the situation in July was determined by what was happening in the supply area: new listings in the 416 area declined by 17 percent on a year-on-year basis, falling from more than 6,000 to about 4,900. Active listings, which are the ones that carry over from month to month since they have not been sold, also decreased by 14.8 per cent. If anyone is attempting to work out whether a bottom is being formed, then these figures are the ones that should be watched.
The reason is that price is a lagging indicator since it shows you where the market has been. On the other hand, the number of new listings, the number of active listings, and the amount of inventory are leading indicators because they indicate where the market might be going. If you notice sales volume increasing at the same time that the numbers of new and active listings are decreasing, then you are seeing supply become tighter in the face of steady demand. This is the mechanical situation that comes before stabilization.
At the same time, the average price for all kinds of homes in the City of Toronto is just above $1 million, a decrease of 3.2 per cent compared with the previous year. Although this decline appears more significant than it actually is. A large part of the drop has already taken place, and the current situation seems less like a downward trend and more like a market that is starting to move sideways – there being 4.6 months’ worth of inventory for homes in the 416 area means that we are now in territory characteristic of a balanced market.
The Condo Comeback Nobody Reads About in the Headlines
The most noteworthy figure is this: condos in the 416 have reached their 2026 high point for average price at about $672,000, which represents the highest monthly average to date this year. More than a thousand condos were sold in July, during the World Cup and in the hot summer months when the prevailing view was that the market had died.
There would be a great mismatch if all you did was read the headlines in the newspaper and then look at the averag eprice at which it was being sold. – Ralph Fox
The gap between feelings and actual circumstances is the central theme of this whole market. As Ralph Fox has pointed out, if there have been more than a thousand condo sales then at least two thousand people must have sat face to face with one another during a month which all concerned had believed to be frozen. The stories we heard throughout the city in July match exactly what the data is showing us. Recently we sold a penthouse which had been on the market for two years. We also took over a luxury condo that had been listed by another agent for over a year and managed to sell it in July too. A small studio which had had very few viewings over a month suddenly received several offers. This shows that the condo market is tightening and that interest is returning something we have not experienced for years.
There is also a rather slight change in the people making the calls. At this time of year we usually arrange for fall sellers to be lined up; instead the team is now spending more time onboarding fall buyers, which is a reversal from the previous two years and is worth mentioning.
Why Sellers Are Sitting on Their Hands
The 17 percent drop in new listings raises an obvious question. Where did the sellers go?
In a market where property values are rising quickly, homeowners would simply check their home’s price by putting a listing out to see how much it might fetch. Nowadays, however, this kind of behaviour no longer exists. Present-day sellers are careful and those who decide to put their property on the market are generally doing so because of a real-life event such as a death, a divorce, or the arrival of a new child, not out of opportunism. All the others are, quite reasonably, choosing to delay instead of accepting a price that they suspect they’ll regret in a few years.
The seller-agent relationship has been transformed in a manner never before witnessed. Nowadays, sellers regularly interview three or four agents before deciding on which one to select. In previous booming years, a homeowner could hire almost anybody and the property would ‘sell itself’. Today, however, the focus is on strategy – namely, who is going to represent them, why, and exactly what steps they plan to take to sell the house in such a way that it will stand out. Both buyers and sellers are also thinking much further in advance; we already have several clients who are preparing for a sale in spring 2027, and this is actually a more sensible approach than it may at first appear. If you’ve lived in a low-rise home for twenty or thirty years, it can take four months just to declutter, repair and stage the property before you get it onto the market.
In August the number of listings can be expected to be limited before rising to the normal level in September, October, and November. Although TRREB has indicated that buyers might have less room to negotiate as a result of a tightening in the supply, it would still be premature to say that this situation has already come about.
The Price Paradox: More Dramatic on Paper Than in Practice
If you look at a chart showing the average prices and it seems alarming, a closer examination shows that the gap between the lines is actually small. The average has been moving within a narrow range, staying between $1 million and $1.025 million, and has only once dropped just below the million-dollar figure before recovering again.
To put it in context, the peak in the City of Toronto in February 2022 was approximately $1.2 million, which means that there is now roughly a $200,000 difference between the previous market peak and the current level. Yet, for the last 12 months we have remained within the million-dollar range. The kind of prolonged sideways movement that characterises a bottom – no matter how one defines that term is all too common. A calm, stable and predictable market benefits everybody: buyers, sellers, renters, landlords and agents.
The Four Segments, Broken Down
Combining all the types of homes together masks the important differences. The performance of the four “416” segments in central and downtown Toronto in July compared with the same month the previous year was as follows:
Detached sales rose 2.8 percent. The average price fell 1.5 percent
For semi-detached houses the figures show a 6.8 per cent falls in sales and prices having dropped by almost 10 per cent; that is the unexpected part. Since the semi-detached house has for a long time been the most in demand of all property in the city, this lack of demand goes against what was expected.
Sales of townhouses and row homes have increased by 8.7 per cent with the average price being about $865,000, which is a decrease of about 6 per cent.
Sales of condo apartments rose by 3.3 per cent, the average price fell by 1.6 per cent, and there were more than a thousand transactions during the month.
The segment to keep an eye on is the semi-detached one since it has historically been the most competitive and tightly contested of all the property types in central Toronto; therefore, a price decrease of double digits together with falling sales constitutes a real anomaly and should be monitored until fall
The 416 Versus the 905: Location Still Insulates
Central and Downtown Toronto are still doing better than the suburbs, and the difference is growing. Sales in the 905 area fel. by 2.3 per cent whereas those in the 416 area increased. Regarding prices, detached houses declined by 1.5 per cent in the 416 area compared to a drop of 6.7 per cent in the 905 area, and condominium prices fell by 1.6 per cent in the 416 area compared to a decrease of 5 per cent in the 905 area.
This is due to lifestyle factors. With compulsory return-to-office policies, buyers are being drawn back to walkable areas where they can carry out all their activities on foot, since few people are happy with a 90-minute journey each way by highway. However, the main takeaway is the most fundamental one in the real estate business: location, location, location. Properties in a better location fetch a premium, and it is premium that protects a property when the market is down and enables strong appreciation when the economy recovers. When looking at wealth building over the long term, central and downtown Toronto has always beaten the more distant areas, and there is no good reason to think that this situation will change.
Days on Market: Selling Takes Longer Now, and That’s Normal
A moment to make something clear since it often causes confusion. “Listing days on the market” refers to the length of time it takes for a property to sell, calculated from the date the listing is published until the property is taken off the market. “Property days on market” is the total number of days that a house has been listed, taking into account any terminations and relistings. The kind of chart that most people come across shows the listing days on the market for that particular listing.
On that basis, the average in July was 32 days, a small increase compared to the 30 days recorded the previous year and slower than in May, which was the month of highest velocity that year; nevertheless, the trend is encouraging since it represents a decrease on the 45 days seen in the very slow period of January.
The practical advice for those who sell is to adjust their expectations, since the process this time is slower and less glamorous than in earlier markets.
The Economic Backdrop and the Long View
If we step back from the monthly fluctuations, the bigger picture indicates that interest rates will tend to decrease in the long term. In the short term, the Bank of Canada might decide to keep them unchanged as the trade tensions with the United States continue, and it might reduce them if the situation worsens. Although higher rates appear unlikely, many people do not agree.
The main argument is that, as AI and robotics automate parts of the economy over the next three to five years, there will be a deflationary pressure; production and service costs will decrease, more jobs will be lost, government debt will increase, and all of these factors will in the end require greater liquidity and a low-interest-rate environment in order for the system to continue operating.
There is no one-size-fits-all answer when it comes to the long-standing debate between fixed and variable rates; it all depends on your level of risk tolerance. Those buyers who are happy to pay extra in order to have the security of a fixed rate and the peace of mind can certainly make that a completely reasonable decision.
What This Means For You
If you’re a buyer than our advice is to give up on searching for the one lowest price and instead concentrate on value, that is, on what you actually receive in relation to how much you pay. You can prevent yourself from overpaying by going against the majority when sentiment is negative, since people have a tendency to overpay when there are a lot of buyers. It is almost impossible to manage the task of trying to hit the very bottom.
When considering the purchase of low-rise houses, semi-detached homes and detached houses, you should act more quickly because that type of property is likely to see a recovery sooner than condos, in which substantial appreciation might not occur for a few years yet. You should base your decision on what is appropriate for your own life and your family and make use of a rare opportunity in which buyers are still able to negotiate and carry out proper due diligence; this opportunity will not remain open forever.
For those who are buying a condo for the first time, it is advisable to create a detailed spreadsheet and make use of tools such as ChatGPT or Claude to organize the comparison between renting and buying depending on how long you actually intend to remain in the property. Performing the calculations with a five-year time frame is one of the best things you can do. The buying section of Fox Marin’s website explains how the company assists buyers in assessing available options and negotiating strategically under changing circumstances.
If you’re a first-time buyer considering a condo, then create a thorough spreadsheet and use tools such as ChatGPT or Claude to organize it, allowing you to compare the costs of renting with those of buying depending on how long you actually intend to remain in the property. One of the best things you can do is work out the figures assuming a five-year time frame. For a more in-depth introduction to financing, deposits and the actualities of buying your first home, Fox Marin’s First-Time Home Buyer Academy was designed specifically for this stage.
If you’re seller, you should be deliberate. At the moment there are no easy sales, so you must be clear about your reasons for selling, decide precisely what you’ll do with the money, identify where you actually want to go and make sure that your timeline truly calls for taking action now rather than waiting until next spring. When setting the price for your property you must use the sales figures from the last 90 days of comparable sales, not those from currently active or from hypothetical figures. The price you choose must be up to date and justifiable. And if you can’t tolerate the lower side of a realistic price range, then it’s obviously not the right time for you to sell, since today there are no record-breaking prices available. Fox Marin’s Selling Page details how pricing strategy, presentation and timing influence the results, even in a sluggish market.
If you’re someone who wants to buy or sell and is waiting to move forward, you should keep an eye on the key indicators such as the level of inventory, the number of new properties coming onto the market, and the number of days properties remain on the market, rather than focusing too much on the price figure which is most prominent in the news. While the price shows you where the market has been, it’s the supply figure that indicates where it’s headed. You should also be cautious about clickbait, since there is a great deal of fear-mongering regarding the market, and especially the condo market, which has been deliberately created to generate clicks on social media. A well-balanced, data-based method is far more useful to you than a flashy video that is intended to attract clicks. It’s never a good idea to hand over your judgement to a thirty-second clip or an emotionally charged reel.
The Fox Marin Perspective
If you remove the summer distortions and the pessimistic headlines, the picture for July 2026 is one that is cautiously optimistic. Sales are increasing slightly, the number of new and active listings is decreasing, prices are staying about the same rather than falling, and the condo sector quietly reached its peak for the year. All of this suggests that the market has not yet bottomed out, and no one should want to be the one to say that while the market is still working out its position. However, the leading indicators are pointing in the correct direction, and the following months, from September through November, will show us a lot about where the fall and the spring of 2027 will end up.
The main lesson is something we keep coming back to. It’s important to think in the long term, to concentrate on value rather than price, and to associate yourself with people who actually know the neighbourhood where you are buying or selling. Markets of this kind reward intention and experience.
If you’re attempting to decide on your next step whether that involves getting into the low-rise recovery, dealing with the condo market, or timing or sale for spring 2027, Contact us (We’re Nice!).
Frequently Asked Questions
The data from July 2026 indicates only very early and uncertain signs of stabilization rather than a full recovery. Sales in the 416 area increased by 1.7 per cent on an annual basis, but new listings decreased by 17 per cent and active listings dropped by 14.8 per cent. Since supply indicators come before price changes and prices respond later, this situation implies that the market might be reaching a floor, although the upcoming fall months will provide a better indication.
In July 2026 the average price for all types of home in the City of Toronto (416) was just above $1 million, which represents a 3.2 per cent decrease compared with the previous year. The peak price in February 2022 had been about $1.2 million, so there is a difference of approximately $200,000 between the market peak and the current level
Condos in the 416 area reached their 2026 peak in July, with an average price of about $672,000 and more than 1,000 sales that month. Although this is still less than peak price of about $820,000 in February 2022, it goes against the general belief that the condo market has collapsed.
That depends on your own situation, but this is a rare window for buyers, with room to negotiate and the chance to carry out proper due diligence – conditions that were not present during the more frantic years. Our advice is to concentrate on long-term value rather than trying to time the exact bottom, and to act with more urgency on low-rise homes than on condos, since low-rise homes are likely to recover sooner.
The average time that a property remained on the market in July 2026 was 32 days, a small increase compared to the 30 days it had been in the previous year but a decrease from the 45 days it had taken in January. Nowadays the process of selling is slower and more methodical than it was during the peak years of the market, because buyers take time over viewings, due diligence and making conditional offers.
The central area is outperforming the suburbs. In July 2026 sales in the 416 went up while those in the 905 decreased by 2.3 per cent. Detached house prices fell by 1.5 per cent in the 416 as compared with a fall of 6.7 per cent in the 905, and condo prices dropped by 1.6 per cent compared with 5 per cent. Properties in better locations tend to be protected during downturns and tend to lead in recoveries.
This is a personal choice that depends on your tolerance for risk, and it is something to discuss with a licensed mortgage professional rather than a real estate broker. Some borrowers prefer the security of a fixed rate and are willing to pay a premium for peace of mind, while others are prepared to accept some short-term fluctuation. There is no single correct answer.
Focus on the leading indicators: months of inventory, new listings, and days on market. These reflect supply-and-demand dynamics and point to where prices are headed. Average price is a lagging indicator that tells you where the market has already been, which is why it is a poor tool anticipating a turn.
Stay Ahead of the Market
Looking for more Toronto real estate insights, leasing advice, and market updates from the Fox Marin team? Explore the latest blogs and podcasts episodes for in-depth analysis, neighbourhood insights, and conversations about where the market is headed next:
Fox Marin continues to be one of Toronto’s most recognized downtown real estate teams, with more than 550 five-star Google reviews, over 1,000 successful transactions, and more than $580 million in sales volume. (*Source: Jan. 1, 2018 – Sept 1, 2025, RE Stats Inc. & Exclusive)
—
This article was written by Ralph Fox, Broker of Record and Managing Partner here at Fox Marin Associates. Ralph is a Torontonian native who recognized from an early age that the most successful people in life apply long-term thinking to their investments, relationships, and life goals. It’s this philosophy, along with his lifelong entrepreneurial drive and exceptional business instincts, that help to establish Ralph as a top agent in the real estate market in downtown Toronto.
Stay Ahead of the Market
Looking for more Toronto real estate insights, leasing advice, and market updates from the Fox Marin team? Explore the latest blogs and podcasts episodes for in-depth analysis, neighbourhood insights, and conversations about where the market is headed next:
Fox Marin continues to be one of Toronto’s most recognized downtown real estate teams, with more than 550 five-star Google reviews, over 1,000 successful transactions, and more than $580 million in sales volume. (*Source: Jan. 1, 2018 – Sept 1, 2025, RE Stats Inc. & Exclusive)
—
This article was written by Ralph Fox, Broker of Record and Managing Partner here at Fox Marin Associates. Ralph is a Torontonian native who recognized from an early age that the most successful people in life apply long-term thinking to their investments, relationships, and life goals. It’s this philosophy, along with his lifelong entrepreneurial drive and exceptional business instincts, that help to establish Ralph as a top agent in the real estate market in downtown Toronto.
Ralph Fox & Kori Marin
Kori and Ralph's love affair with Toronto Real Estate have spanned several decades! It is incredible to see how far their mad crazy passion for design, architecture and innovation has taken them, which is only the beginning of their bigger vision and relentless goal-setting! Kori and Ralph have created this forum for their readers to explore the good, the bad, and the sometimes ugly real estate. An honest perspective about the ins & outs of the business - one in which they live, work and experience first hand every day. Nothing is more interesting than the "real" in real estate!