Part One: East versus West – A Decoding of Toronto’s East End House Prices over a Decade
If you ask two people from Toronto which side of Yonge Street is better, you might not want to be in the room when they give their answer. The debate between the East and the West is one of Toronto’s longest-standing rivalries, equally rooted in civic pride, affordability, and loyalty to a way of life and community.
We therefore decided to settle the debate in the only way that we know how: by using data. This article is the first of a two-part series on Toronto’s East End and focuses on the data aspect. In it, we examine how each of the major neighbourhoods in the area has fared over the last ten years, what it actually costs to buy property in each one, and how the schools compare. Part Two will look at the lifestyle situation, transit options and the question of future growth, including the Ontario Line, the up-and-coming areas, and where smart money currently intends to invest.
The most important point to keep in mind while you’re reading is that over the past ten years almost everything in Toronto’s Lower East Side has seen its value rise; freehold homes have outperformed condos by more than 40 points, and the single best-performing area during the decade is also the one that is furthest away from its 2022 peak. It is in the details that the true insight can be found.
Watch the Full Episode
Would you rather watch rather than read? In this episode, Ralph Fox and Kori Marin talk about the subject and offer some useful insights which they have gained from assisting hundreds of buyers and sellers in Toronto.
First, a Map: Why These Neighbourhoods Are So Confusing to Name
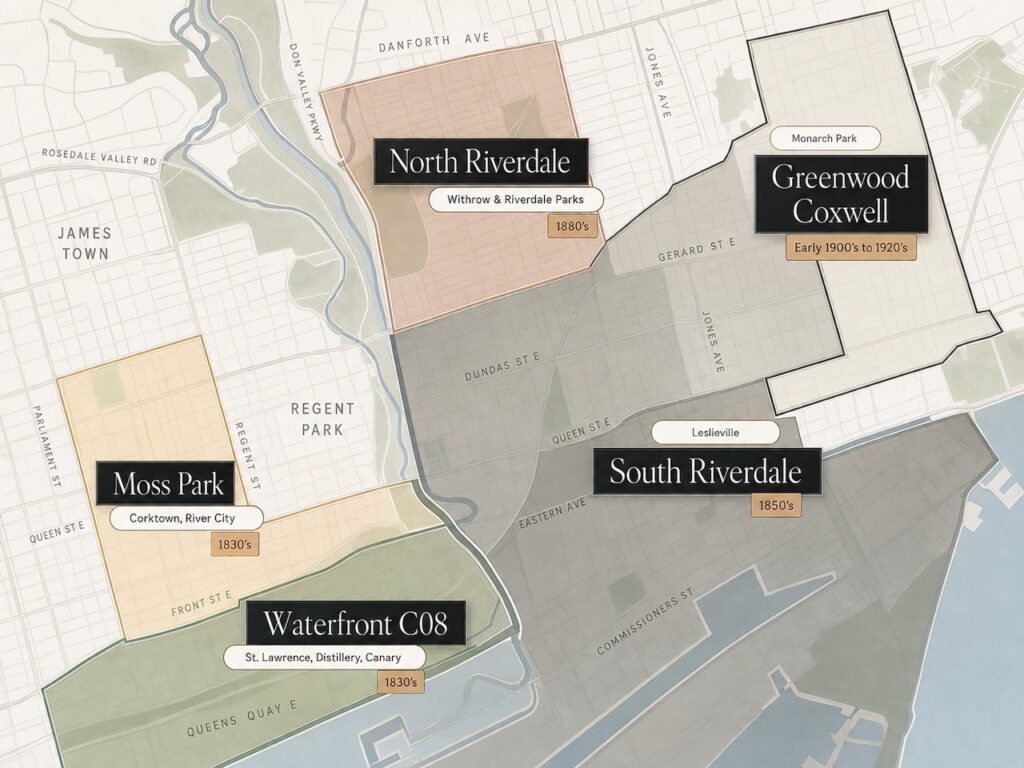
You won’t be able to make sense of the data until you realize a feature that even experienced buyers find confusing: the name of a neighbourhood completely depends on who is giving it a name. The MLS system, the City of Toronto’s ward map, and the way people living there refer to their own streets, for example, don’t always agree.
As for Leslieville, most Torontonians and east enders understand and agree on its location, but on MLS it appears as South Riverdale, in district E01. The old Riverside neighbourhood near the Broadview Hotel, at the intersection of Queen and Broadview, has now been included in the same South Riverdale designation. North Riverdale, which most people call Riverdale, is also in E01. So is Greenwood-Coxwell, even though it is sometimes known as Monarch Park on its northern side.
It then becomes truly complicated. Although Corktown is the area with the most distinct character along King Street East and extending into River City, it is part of Moss Park in district C08. The Distillery District and the Canary District cannot be separated from the MLS; to obtain the data, an agent has to draw a circle around them on the map. St. Lawrence Market is also included in C08.
What does this have to do with you if you’re a buyer or a seller? It’s because the label given to a property in a listing affects people’s perception, and that perception, in turn, determines the price. As Kori Marin, a broker and co-founder of Fox Marin, points out, a lovely home in Corktown that the MLS forces you to list as being in Moss Park ends up with a stigma that it doesn’t necessarily deserve:
“If we were able to market them using an MLS geography that said Corktown, people would feel so differently about the property.” – Kori Marin
The first element of local knowledge that enables a buyer to be informed rather than confused is an understanding of the difference between the MLS map and property marketing, and a fundamental understanding of the city’s neighbourhood, which is paramount before ever considering offering a property.
Take, for instance, old Toronto on the east side, which is very often overlooked and one of Toronto’s hidden gems. Toronto, as it once was, in a way most people never really appreciate. As Ralph Fox, the broker of record at Fox Marin, says:
“Going back to the 1830s, these are pretty old parts of Toronto and predate the Canadian Confederation, which is really interesting.”
It is precisely because of this heritage that strolling through St. Lawrence Market, the Distillery District, or certain areas of Corktown provides a different experience than some other desirable areas on the east end. In the case of Corktown, for example, a great deal of the original existing architecture has been preserved rather than torn down, thereby giving it a charm that other districts have to create from scratch.
The Winner’s Circle: A Decade of East End Performance
When looking at the data, on the Lower East Side, Many will be surprised that the property which had the best rate of performance over the decade was not a heritage house in Riverdale but rather the condos in the C08 waterfront area, which have increased by about 107 percent compared with ten years ago. However, this is accompanied by a huge caveat which we will dig into later in the conversation.
Let’s look at each pocket in turn.
1/ SOUTH RIVERDALE (LESLIEVILLE): THE TRENDY END-USER MAGNET
Over the last fifteen years, aka Leslieville has changed more than almost any other neighbourhood in the city. It has moved from a place where agents would ask why anyone would want to live there to one of Toronto’s most sought-after areas for families. As Kori Marin, who has been selling properties throughout the East End for about fifteen years, recalls:
“I remember going out to this pocket and being like, why would anyone want to live in South Riverdale? And now it’s just exploded.” – Kori Marin
Over the last ten years, house prices in South Riverdale have risen by 68.5 percent, compared with an increase of 28.2 percent for condo apartments during the same period.
For someone considering buying on the east end, the way these homes have fared since the first quarter of 2022 has shown incredible resilience. Detached houses have fallen by only 3.5 percent from their peak, to $1.795 million. Semi-detached houses have dropped by 15.3 percent, a decline that Fox Marin anticipates will decrease over the year. Townhouses and row houses are down 8.7 percent. Condo apartments, as one would expect, have been the hardest hit, with a decline of 23.1 percent below peak.
The average condo in the area is now just under $700,000, or approximately $850 per square foot. What strikes people most is the strength shown by the semi-detached and detached segments. Ralph Fox explains that this resilience, in the midst of this downturn, is due to the type of buyers and homeowners attracted: the majority of owners intend to stay in the property and communities for the long term. This kind of ownership pattern has a composed yet significant stabilizing effect.
2/ NORTH RIVERDALE: THE TRADE-UP NEIGHBOURHOOD
North Riverdale is the more expensive and better-established of the two. Since there are very few townhouses or condos, the relevant data is specific to detached and semi-detached houses. Both types of properties have increased by about 60 percent over the ten years. Currently, the average price of a detached house in 2026 is $2.2 million, and that of a semi is $1.77 million. Although detached homes are 11 percent below their peak value, semis have risen by 0.7 percent, a clear indication of demand to enter the area.
“The typical buyer is probably trading up from your house in South Riverdale, or a condo from another area, typically with family support. This is more of a second or even third-time home purchaser.” – Ralph Fox
There are few properties on the market; the lots are larger, the houses are bigger, and it is common for offer nights to attract seven, eight, nine, or ten competing bids, even during the worst phase of the recent downturn. However, every area has its tradeoff. Kori Marin, who states that she could easily live in North Riverdale herself, has one comment about the area’s narrow streets:
“Driving on the streets is like playing chicken a little bit. The streets are really narrow, so you’re always coming head to head with another car.” – Kori Marin
As a result, properties with parking often sell at a significant premium.
3/ GREENWOOD-COXWELL: THE FIRST-TIME BUYER’S OPPORTUNITY
If you’re considering buying a property for the first time, Greenwood-Coxwell offers great value and is often a mecca for first-time buyers on the east end. The area is still very much gentrifying and, even though no part of downtown Toronto is genuinely affordable these days, prices here are more reasonable than in the more fashionable neighbourhoods to the west.
With a lower entry point, appreciation has been lower than in other east-end neighbourhoods, as expected. Over the past ten years, the number of detached houses has appreciated by 33 percent, for semis by 53 percent, and for townhouses by 42 percent. The year-to-date averages are $1.3 million for detached houses, $1.1 million for semis, and just over $1 million for townhouses. The recent correction has also been harder on detached houses, which have fallen by 15 percent from their 2022 peak, and semis down by 14.7 percent, and townhouses by 23 percent.
This is the neighbourhood Fox Marin would point a first-time buyer toward right now. Gentrification is visible on the ground, especially along the Gerrard corridor into Little India, where new restaurants and coffee shops keep popping up. Retail change is one of the most reliable leading indicators in real estate. When the storefronts start turning over to younger, hipper, independent operators, the side streets are usually not far behind. If you are just getting started, our guide to Understanding the Toronto Real Estate Market: A First-Time Buyer’s Guide is the right starting point, and Fox Marin’s First-Time Home Buyer Academy goes deeper on financing and deposits.
4/ CORKTOWN AND MOSS PARK: A TALE OF TWO BRANDS
Corktown is a unique part of Toronto with many heritage row houses and more recent condo developments; however, it lacks detached and semi-detached houses. Over the last ten years, row houses have declined by 6.6 percent, whereas condo apartments have appreciated by 26 percent. Since the 2022 peak levels, both townhouses and condos have fallen by about 25 percent.
The challenge is that MLS combines the attractive part of Corktown with the more rugged, grittier northern areas of Moss Park into a single data set. As Ralph Fox points out, Corktown has a much more favourable connotation than Moss Park; the two names conjure completely different mental images, and the housing and larger end-user condo units found in Corktown have very little to do with the areas most people associate with Moss Park. While MLS makes the distinction between these two distinct neighbourhoods highly confusing, Toronto Transit has been very clear. Metrolinx has decided to call the new stop in the area Corktown Station, not Moss Park Station. This reflects the right branding choice and suggests where public perception and pricing might go as a result of the new transportation infrastructure.
5/ C08 WATERFRONT: THE DECADE’S CHAMPION, WITH AN ASTERISK
Most would be shocked by the fact that the condo properties in the C08 waterfront area, including the Distillery District, the Canary District, and the towers extending south all the way to the lake, outperformed all the other asset classes on the Lower East Side over the ten years, showing a 107% increase in pricing appreciation.
Given the current state of the condo market, how is this possible? Ten years ago, much of the Canary District was empty fields, and the Distillery District was still very much in its early days, so there was lots of room available for upward appreciation.
When considering condos as an investment or a long-term place to live, both the Canary District and the Distillery District offer great value and lifestyle, and both newer areas have strong future potential.
What’s Beyond the Sticker Price: How Many Years of Income Does a Home Cost?
Percentages only tell you so much; to make affordability in the neighbourhoods more readily understandable, we have included a calculation based on Statistics Canada’s average household income for each area, dividing the average price by the average income to arrive at the number of years’ worth of a household’s total income that the house costs. Note that this refers to the full purchase price, not a down payment.
The old rule of thumb held that a house should cost three to four times the buyer’s income; nowadays, houses in these areas cost six to eight times that amount.
Greenwood-Coxwell (with an average household income of $187,000) is about three times the income required to purchase a condo, six times the income required for a semi-detached house, and seven times the income required for a detached house.
In South Riverdale (with an average household income of $221,000), it takes about 3.2 times income to purchase a condo, 6.2 times income for a semi, and 7.8 times income for a detached house.
North Riverdale (with an average household income of $293,000, which is double the city average), it would be 2.9 times income for a condo, 6 times income for a semi, and 7.5 times income for a detached house.
Moss Park, where the average household income is $138,000, is 4.3 times income.
In the Waterfront, which has an average household income of $180,000, it takes about 4.1 times.
For reference, the average income in the City of Toronto is $147,000. In a neighbourhood described as affordable and growing, such as Greenwood-Coxwell, the average household income is nearly $190,000. After paying their expenses, families at that income level are probably not saving much at all. As Ralph Fox says:
“It just goes to show you how expensive a city Toronto really is, even at $300,000 family income.”
That is the quiet, sobering truth: even in the midst of a market downturn, it is how expensive it truly is to live in a city like Toronto. And the purchase price is only part of the picture; our breakdown of The Real Cost of Buying a Home in Toronto walks through the hidden expenses that catch many buyers off guard, while Fox Marin’s Buying Page lays out how the team helps buyers match budget to neighbourhood without overreaching.
Schools: Read the Ratings, Then Look Past Them
School quality is closely linked to property prices in the East End as it is throughout most of the city. With schools being such an important variable to real estate prices, it’s important to know how to interpret it. Although the Fraser Institute is generally regarded as providing the best ranking, many families disagree with its assessment method, and its scores can often be strongly correlated with household income. On the Lower East Side, Pape Avenue Junior Public School leads the local rankings with a score of 9.7 out of 10, while Riverdale High School ranks 8.7.
The Jackman school district in Playter Estates, which is just north of the Danforth, is the most desired catchment area in the wider area, so much so that “highly coveted Jackman school district” has become a standard phrase in property listings. Secondly, and more importantly, don’t accept an agent’s statement about school boundaries at face value, as boundary lines are subject to change. You should consistently verify the school boundary catchments for your specific address with the Toronto District School Board and also speak with families whose children attend that school.
Anyone considering moving to the Canary District with young children should bear in mind an important point. In September 2011, the TDSB set aside a 1.63-acre site at the intersection of Bayview and Mill Streets for a future elementary school, and the board subsequently obtained full ownership of the site. Now that nearly fifteen years have passed, no school has yet been constructed. Metrolinx is currently employing the land for the Ontario Line project and will not return it to the TDSB until September 2028. In the meantime, since 2015, children have had to attend a school located 3.2 kilometres away on the other side of the Don Valley. This school is already at full capacity and is expected to reach approximately double its current capacity by 2029. So, if you are purchasing a property in the area for family purposes, you have to consider your school and daycare arrangements carefully.
The Fox Marin Perspective
If you look beyond the individual figures, the main point that emerges is that the East End has shown tremendous resilience during this correction, and continues to be a highly desirable, gentrifying part of the city. The East End’s prices have fared much better than the headlines suggest during the market downturn.
However, data alone gives only half the story; the question of where you actually want to live depends on your lifestyle, access to transit, amenities, walkability, safety and the direction a neighbourhood is heading in, which is precisely what we look at in Part Two of this series, East vs. West, Part Two: The Ontario Line, Up-and-Coming Pockets, and the Future of Toronto’s East End. If you’d like to get a feel for the everyday atmosphere of these neighbourhoods, our East of the Don Neighbourhood Guide is a loving tribute to the area’s food, parks and local spots.
A number of the Fox Marin team live in East End Toronto and spend their daily lives there. Should you wish to find out more about the figures for a particular area, please get in touch with Fox Marin.
Frequently Asked Questions
In percentage terms, the condominiums in the C08 waterfront area (the Distillery and Canary districts) achieved a return of about 107 percent over ten years. However, this figure is based on a starting point that was almost entirely undeveloped ten years earlier. Of the more established freehold areas, detached houses in South Riverdale (Leslieville) had the highest return at 68.5 percent.
The MLS lists the area that residents refer to as Leslieville as South Riverdale in district E01; the former Riverside area near Queen and Broadview has also been included in this designation. It is one of several locations where MLS terminology differs from ordinary day-to-day usage.
The extent of the decline depends on the area. Condos in South Riverdale are down by about 23.1 percent from the Q1 2022 peak, waterfront condos are down by about 19 percent, and those in Corktown/Moss Park are down by roughly 25 percent. Freehold houses have fared much better, with some sections a few points above the peak, or even slightly above it.
Detached houses in these areas amount to about seven to eight years’ worth of a household’s total income on average; semi-detached houses, about six times that; and condominiums, about three to four times that. This figure includes the full purchase price and the down payment.
The area that Fox Marin most frequently recommends to first-time buyers is Greenwood-Coxwell. The prices there are still more affordable than in more fashionable neighbourhoods; the area is obviously undergoing gentrification, and it provides a realistic opportunity for people to enter the low-rise market.
There are several schools in the Lower East Side with high ratings, with Pape Avenue Junior Public School (9.7 out of 10) and Riverdale High School (8.7 out of 10) leading the way. The catchment area for the Jackman district in Playter Estates is the most desirable. Since the ratings do not immediately reflect changes in the neighbourhood and the boundaries do shift, it is necessary to verify your exact address with the Toronto District School Board and speak with local families.
Stay Ahead of the Market
Looking for more Toronto real estate insights, leasing advice, and market updates from the Fox Marin team? Explore the latest blogs and podcasts episodes for in-depth analysis, neighbourhood insights, and conversations about where the market is headed next:
Fox Marin is recognized as one of Toronto’s most trusted real estate teams, with 550+ five-star Google reviews, more than 1,000 successful transactions, and over $700 million in sales volume. (*Source: RE Stats Inc. / Loft47, Jan. 1, 2018 – Aug. 31, 2026)
—
This article was written by Ralph Fox, Broker of Record and Managing Partner here at Fox Marin Associates. Ralph is a Torontonian native who recognized from an early age that the most successful people in life apply long-term thinking to their investments, relationships, and life goals. It’s this philosophy, along with his lifelong entrepreneurial drive and exceptional business instincts, that help to establish Ralph as a top agent in the real estate market in downtown Toronto.
Ralph Fox & Kori Marin
Kori and Ralph's love affair with Toronto Real Estate have spanned several decades! It is incredible to see how far their mad crazy passion for design, architecture and innovation has taken them, which is only the beginning of their bigger vision and relentless goal-setting! Kori and Ralph have created this forum for their readers to explore the good, the bad, and the sometimes ugly real estate. An honest perspective about the ins & outs of the business - one in which they live, work and experience first hand every day. Nothing is more interesting than the "real" in real estate!