East vs. West, Part One: A Decade of Toronto’s West End House Prices, Decoded
Part one of The West End in our East-versus-West series focuses on the data. In it, we analyze how five of the West End’s most desirable areas Trinity Bellwoods, the CO1 waterfront, Niagara and Liberty Village, Roncesvalles, and the Junction have fared over the last ten years, what they cost now, and what it actually takes to afford them. Part Two will examine the transit lines, major developments, and emerging corridors that will shape the next decade.
The one point you should take away is that each of the West End segments we looked at ended the decade up by between 16 and 70 percent, with no exception. However, the recovery since the 2022 peak has been uneven, and the properties which have preserved their value most effectively are not the ones that most people would expect. As usual, it’s all in the details.
Watch the Full Episode
If you’d rather watch than read, in this episode Ralph Fox and Kori Marin look at the subject and provide practical insights they’ve gained from assisting hundreds of buyers and sellers in Toronto.
First, the Name Game: How TRREB Actually Carves Up the West End
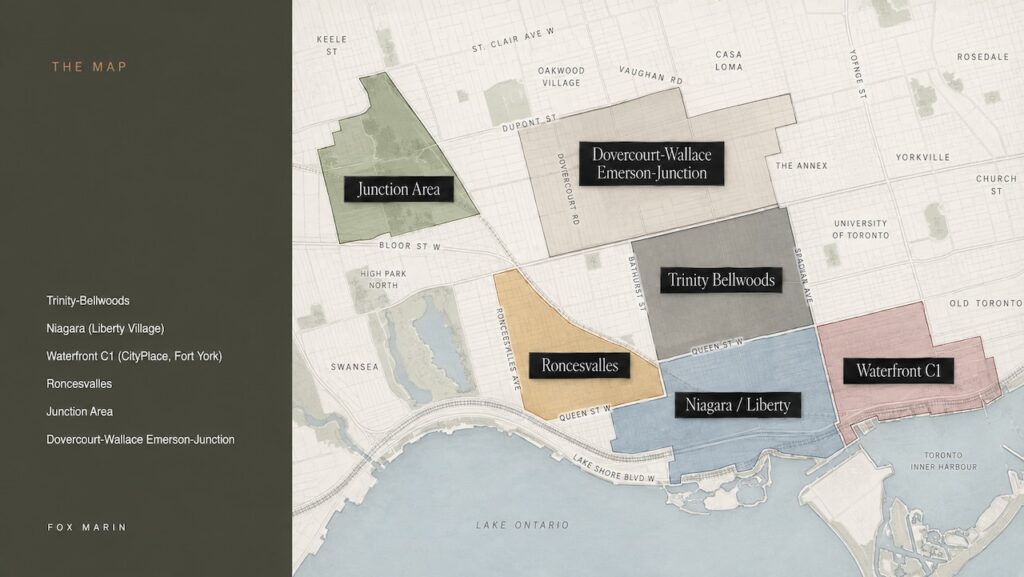
Even experienced buyers and brokers often overlook this, which can be a major source of confusion: The Toronto Regional Real Estate Board’s method for dividing these areas differs from how people actually refer to them, and the boundary lines intersect in ways that can mess up the data. The following is a general overview of how the TRREB presents these areas, as there is no survey that clearly delineates King West or Queen West.
The most confusing case is Liberty Village, since it does not have its own TRREB community and is instead included in a district known as Niagara, listed as C01; moreover, the areas of King West and Niagara also extend into the C01 waterfront. This C01 waterfront district encompasses the large block of condos that includes CityPlace, Fort York, the Harbourfront towers and a part of King West. Trinity Bellwoods is a community in its own right and is also assigned to C01. Roncesvalles, or Roncy, has its own community under W01, and the Junction is farther west and north, falling within W02.
So what does any of this concern you if you are a buyer or a seller? It’s because the label used on a listing and the geographical area from which the data is taken affect both people’s perceptions and the price. The fact that Liberty Village is actually situated within Niagara, or that the waterfront data includes a large swath of very different buildings, makes it very easy to distinguish between understanding the market correctly and being misled by the data.
Some historical background also helps make these areas easier to understand. Trinity Bellwoods was established in the 1850s, developed by Victorians in the late 1800s and early 1900s, and became genuinely fashionable in the early 2000s. Roncesvalles was likewise settled in the 1850s, with the bulk of its development occurring between about 1908 and 1924.
Niagara and Liberty Village were industrial and institutional areas in the 1850s, only becoming loft condos in the 2000s. Ralph Fox recalls looking out over Liberty Village when it was still just an open field, and the now-famous Toy Factory was unoccupied. The C01 waterfront was originally railway land and was not made residential until the Harbourfront boom of the 1980s, CityPlace being the area’s first major development when it arrived in 2002.
All the areas have interesting origin stories.
“The Junction had a dry area, meaning you were not permitted to sell alcohol, until the late ’90s and early 2000s. It actually wasn’t even part of Toronto at the time.” – Kori Marin
The area had seen wet votes rejected in 1966, 1972, 1984 and 1988, each of which required a 60 percent supermajority to overturn the ban. The Junction did not join Toronto until 1909 and did not begin serving alcohol until the 2000s.
As Ralph Fox said, ”It is a neighbourhood which achieved its genuine modern revival well within our own lifetime, which is precisely the reason for its recent gentrification”
The Winner’s Circle: A Decade of West End Performance
All the asset classes we looked at showed gains over ten years. We will now go through each category in turn.
1/ Trinity Bellwoods: Where Character Condos Beat the Houses
Trinity Bellwoods achieved the most unexpected outcome of the decade. Over the ten years, the average detached house has increased by 16 percent and now averages $1.6 million on a year-to-date basis.
However, this figure is still heavily affected by the 2022 peak, when the average detached house in the area reached $2.5 million, meaning detached homes are now down about 35 percent from that peak. The value of semis has risen by 45 percent over the decade and is 11.4 percent below its peak. Townhouses have increased by 25 percent and now average $1.2 million, which is 25 percent below their 2022 peak.
What is surprising is the condominiums. Year-to-date, the average price of a condominium in Trinity Bellwoods is $877,000, representing a 42 percent increase over the last decade of only 4.7 percent from its peak, which is only a small part of the decline that detached houses have undergone. The explanation lies in the character of the area: it is made up entirely of warehouse and loft conversions rather than investor-oriented micro one-bedroom units and one-plus-dens, which are typical in other West End neighbourhoods.
“People want to live in a community and in a neighbourhood, not something that’s off the shelf.” – Kori Marin
Ralph Fox believes there is a real opportunity here because these conversions lofts can’t be duplicated.
Since scarcity helps preserve value, this type of property is likely to see an increase in value as the market recovers. For those interested in a home that maintains both its character and its value, our analysis of the Real Cost of Buying a Home in Toronto will be a helpful addition, since the quoted price is only one part of the whole picture.
2/ The C01 Waterfront: Better Than the Headlines, with Big Caveats
Imagine a downtown area focused on condominiums that incorporate communities like Fort York, CityPlace, parts of King West, and the Harbourfront towers. Since there aren’t enough houses in these communities to examine, the only meaningful data available is on condos. Ten years ago, the typical waterfront condo sold for about $500,000; this year it’s averaging $718,000, a 43 percent increase over those ten years. What surprised us when we looked at the figures was that the sector has declined by only 15 percent from its peak, even though a reasonable forecast would have predicted a 25 to 30 percent drop. The average condo is now selling for around $869 per square foot, takes 38 days to sell, and fetches 97 percent of the asking price. On a positive note, this is one of the first areas where first-time buyers are starting to return to the market.
Averaged figures, however, give this area a more favourable impression, and Ralph Fox is honest about the risks involved. The above data refers only to the most attractive properties; they do not take into account the number of units that have been cancelled or never sold. C01 has very high density and a large amount of investor inventory, much of which was purchased off-plan many years ago and is poorly designed and laid out, with inferior finishes, and, in some cases, in this environment, is nearly unsellable as landlords attempt to exit the market. Two further warnings are worth keeping in mind if you are thinking of buying in this community:
“The experience of being on the waterfront is quite different in June and July than in January and February; the idea of being there often tempts people, and it is very cold off the lake during the winter months.” – Ralph Fox
Moreover, the waterfront area is generally a transitory neighbourhood, since it tends to be people’s first stop before they move on or graduate to a more mature neighbourhood. When considering this area, you should carefully consider whether this is the right long-term decision.
3/ Niagara and Liberty Village: The Great Starter Neighbourhood
Since information on detached and semi-detached properties is too limited to permit analysis, our attention in this area is focused on townhouses and condos. Over the past decade, freehold townhouses and row houses have increased by almost 50 percent, with a year-to-date average of $1.3 million and a drop of only 6.9 percent from the market peak in early 2022. Condos have also risen by 50 percent over ten years, which is not surprising given the continuous increase in density. The average price per square foot is just under $850, with properties taking about 35 days to sell at 97 percent of the asking price, and they are 17.6 percent below their peak.
Liberty Village attracts a particular type of buyer, and Kori Marin knows why: at 23 and having just left university, she would have found it very attractive too. The area is walkable within its own boundaries and offers a wide range of everyday amenities, along with a large number of people in the same life stage. Ralph Fox offers a broader view, noting that it has a sense of security and is self-sufficient/isolated from the rest of the city. The “Pleasantville vibes” are especially comforting to parents whose children are moving to the city from the 905, the 705, or abroad.
One real concern about Liberty Village is accessibility. Getting to and from the area is a real problem; the King streetcar is always overcrowded; there are also concerns about the lack of green space, as the neighbourhood was developed at a higher density than more recent developments.
Our honest recommendation is that it is often better to rent than to buy, and if you do decide to buy, look at the outer parts of the district, where traffic, accessibility, overcrowding and green space are far less of an issue; condo buildings like DNA 1,2,3 are always in high demand for that reason.
4/ Roncesvalles: The Family Favourite That Inspires Loyalty
Roncesvalles is a highly sought-after area, and the data shows why. Detached houses have increased by 50 percent over the last decade, with a year-to-date average price of $1.9 million. Semi-detached homes are up 47 percent at $1.5 million. Townhouses have risen by a remarkable 70 percent, with an average price of $1.5 million. Condos, many of which are attractive conversions such as the Robert Watson Lofts, have increased by 34 percent. On the downside, detached houses are down a mere 7.1 percent from their 2002 peak, semis are down 23 percent, and condos are down about 20 percent. The average price of a condo is now just under $1,000 per square foot, with condos taking only 17 days to sell and selling at 98 percent of the asking price.
The fact that the numbers are so tight is evidence of how in demand this community is. People who live in, or are seeking to move to, “Ronces” have a deep affection for this mature yet dynamic community. The area has beautifully tree-shaded streets, attractive houses, dogs on every corner, and a real atmosphere that encourages people to stop and talk to one another, all of which make it a very family-oriented neighbourhood.
Ralph Fox makes a clear comparison: while Trinity Bellwoods has changed and has lost some of its safe, family-friendly atmosphere since the pandemic, Roncesvalles still manages to provide that feeling, in a way more similar to the beaches on the east side, a community that is much loved even though it is somewhat isolated because of poor transit and is similarly valued for its own identity and seclusion fron the rest of the city.
Ralph also mentions the semi-detached homes as one worth watching; at its peak in 2022, the average Roncesvalles semi was almost $2 million, and with it now sitting at $1.5 million, that part of the market seems set for further growth as the market recovers.
5/ The Junction: The Affordable Alternative on the Rise
Patience is rewarded in The Junction. Detached houses have a year-to-date average price of $1.58 million, a 50 percent rise over the past decade; semi-detached homes average $1.25 million, an increase of 46 percent. Townhouses average $1.2 million, a 63 percent rise, and condos remain truly accessible at $635,000, up 51 percent over ten years. The drop in prices has been greater in all categories since 2022: detached homes have fallen by 13.5 percent, semis by 9 percent, townhouses by 17 percent, and condos by 22.8 percent, with condos averaging $789 per square foot, taking 44 days longer on the market, and 97 percent of the asking prices being matched.
The ten-year appreciation chart actually provides more insight: a Junction semi that sold for about $850,000 ten years ago now sells on average for $1.25 million, a notable increase since buyers who had been priced out of Trinity Bellwoods and Roncesvalles found a neighbourhood which closely resembles their character and charm at a more manageable price.
As Ralph Fox points out, the Junction may seem more separated from the city than almost any other area on this list; indeed, it almost doesn’t feel like Toronto at all, but for many buyers, the compromise of taking on greater distance in return for real affordability is precisely what makes it attractive. If you’re just getting started and are considering such trade-offs, a good place to begin is Fox Marin’s First-Time Home Buyer Academy, which looks into financing and deposits in more detail.
Are You Ready to Put These Numbers to Use?
Data of this kind is most effective when combined with your own budget, timeline, and essential requirements, rather than viewed in general terms. If you are actually considering a move to the West End, the quickest way to obtain personalized advice is to let us know what you are looking for. You can begin by filling outFox Marin’s Buyer Intake, a brief questionnaire that helps our team match you with the right pocket, the right kind of property, and a realistic price you can expect in the current market.
Beyond the Sticker Price: What It Costs to Carry a West End Home
Half of the story of affordability involves income and carrying costs. According to Statistics Canada’s figures on average household income by community, the differences in the West End are considerable. Trinity Bellwoods has an income of about $178,000; the C01 waterfront is at around $170,000; the Junction is just under $200,000, specifically $195,000; Niagara and Liberty Village are notably higher at $232,000; and Roncesvalles has the highest income of all at $267,000.
Schools: Use the Ratings as a Starting Point, Not Gospel
The school’s standing is closely linked to property values in the West End and therefore warrants thorough investigation rather than being viewed solely in terms of its rank. The Fraser Institute’s rating is often used as the gold standard. Nevertheless, many families will rely on the school’s neighbourhood, the provincial scores, and the five-year trend, since some schools see their rankings rise as the areas become more densely populated.
The most important thing to do is check that your precise street address matches the one specified by the Toronto District School Board’s catchment area. In various areas, whether the address has an odd or even number or which side of the street you are on will decide which school your child goes to, and that in turn will affect both the price you pay when you buy and the price at which you can later resell your property. Investigate before you make the purchase.
The Fox Marin Perspective
If you step back, the West End presents a straightforward picture: all the segments we examined ended the decade on a positive note, rising from a modest 16 percent to a remarkable 70 percent, despite an average drawdown of about 25 percent from the 2022 peak. The properties that performed most reliably were not the ones that seemed obvious; the character lofts in Trinity Bellwoods and Roncesvalles proved to be much more resilient than trophy detached homes, which serves as a reminder that scarcity and true livability help to preserve value during a downturn.
But data is only half of any real estate decision. Where you actually want to wake up every day comes down to lifestyle, transit, and where a neighbourhood is heading next, which is exactly what we cover in Part Two of this series, East vs. West, Part Two: The West End’s Transit, Mega-Projects and Corridors to Watch. For a feel for the day-to-day texture of these pockets, ourEast of the Don Neighbourhood Guide offers the eastern counterpoint, and it is worth reading both to decide which side of the city is truly yours.
A number of the Fox Marin team not only live in the West End but go about their daily lives there and sell it as well. Should you wish to test the figures for a particular area, please get in touch via the Contact Page on Fox Marin’s website, and we will connect you with the appropriate person to help you make your decision.
Frequently Asked Questions
The townhouses in Roncesvalles led the group, showing a 70 percent increase over the ten years. More generally, all the sections of the West End we looked at ended the decade up by between 16 and 70 percent, with the townhouses in the Junction (which rose by 63 percent) and several condo sections (which increased by roughly 42 to 51 percent) among the best performers.
Liberty Village does not have its own TRREB community and is instead listed under the Niagara district (C01), which also includes parts of King West and the C01 waterfront. This is frequently a point of confusion for people who attempt to look up Liberty Village prices directly.
There are large differences depending on the neighbourhood and the type of property; in Trinity Bellwoods, detached houses are down by around 35 percent from their peak, whereas condos there have dropped by only 4.7 percent. In Roncesvalles, detached homes are down by only 7.1 percent, the C01 waterfront by about 15 percent, and Junction condos by 22.8 percent. Generally speaking, the West End has experienced a drawdown of approximately 25 percent, but the range is wide.
The extent to which this is the case depends on the type of property; character-conversion lofts in Trinity Bellwoods and Roncesvalles have preserved their value much better than investor-driven micro-units, which are typical in the C01 waterfront and Liberty Village. Since they cannot be replicated, these unique flats tend to be more resilient and better positioned to appreciate as the market recovers.
The Junction offers the most accessible entry point, with condos averaging around $635,000 and semis near $1.25 million, generally cheaper than Trinity Bellwoods or Roncesvalles while offering a similar character and community feel. The trade-off is that it feels more removed from the core and has weaker current transit.
According to Statistics Canada, average household income ranges from about $170,000 in the C01 waterfront and $178,000 in Trinity Bellwoods, to $195,000 in the Junction, $232,000 in Niagara and Liberty Village, and $267,000 in Roncesvalles, the highest of the group.
They are a useful starting point but not the whole story. Many families disagree with their methodology, as rankings lag neighbourhood change. Always verify your specific address against the Toronto District School Board catchment, review a school’s five-year trend, and speak with local families, since even which side of a street you live on can change which school your child attends.
Stay Ahead of the Market
Looking for more Toronto real estate insights, leasing advice, and market updates from the Fox Marin team? Explore the latest blogs and podcasts episodes for in-depth analysis, neighbourhood insights, and conversations about where the market is headed next:
Fox Marin is recognized as one of Toronto’s most trusted real estate teams, with 550+ five-star Google reviews, more than 1,000 successful transactions, and over $700 million in sales volume. (*Source: RE Stats Inc. / Loft47, Jan. 1, 2018 – Aug. 31, 2026)
—
This article was written by Ralph Fox, Broker of Record and Managing Partner here at Fox Marin Associates. Ralph is a Torontonian native who recognized from an early age that the most successful people in life apply long-term thinking to their investments, relationships, and life goals. It’s this philosophy, along with his lifelong entrepreneurial drive and exceptional business instincts, that help to establish Ralph as a top agent in the real estate market in downtown Toronto.
Ralph Fox & Kori Marin
Kori and Ralph's love affair with Toronto Real Estate have spanned several decades! It is incredible to see how far their mad crazy passion for design, architecture and innovation has taken them, which is only the beginning of their bigger vision and relentless goal-setting! Kori and Ralph have created this forum for their readers to explore the good, the bad, and the sometimes ugly real estate. An honest perspective about the ins & outs of the business - one in which they live, work and experience first hand every day. Nothing is more interesting than the "real" in real estate!